Following the powerful 30% upswing that occurred last week, Ethereum (ETH) investors are now taking profits, pocketing $1.5 billion and causing a temporary price drawdown from the recent high of $2,700 to approximately $2,530. In spite of rising selling pressure reflected in such key indicators as Age Consumed and Mean Coin Age, bullish sentiment is still supported by large inflows into accumulation addresses and staking protocols. ETH has major resistance levels of $2,750 and $2,850, where sustained breakout would authenticate a bullish flag pattern and the way to the $3,000 level. Technical indicators point to some diminishing momentum, however, and breaking below $2,100 could provide the window to further losses.
KEY LOOKOUTS
• Investors in Ethereum have made $1.5 billion worth of profits after last week’s 30% price rally, triggering short-term selling and a dip in price below $2,550.
• In spite of the pullback, more than 640K ETH flowed into accumulation addresses and staking protocols, indicating continued bullish demand from long-term investors.
• ETH will need to break and hold above $2,750 and $2,850 to verify a bullish flag pattern, which will drive the price towards the $3,000 psychological level.
• RSI, Stochastic Oscillator, and MACD indicate declining bullish strength, prompting caution for a possible more profound correction if the support at $2,500 and $2,100 is broken.

Ethereum (ETH) investors have started taking profits, cutting out $1.5 billion and inducing a short-term price correction from recent highs of about $2,700 to the levels of about $2,530. In spite of this selling pressure, bullish sentiment is still in place as more than 640K ETH went into accumulation addresses and staking protocols, which shows long-term interest continues unabated. ETH now has crucial resistance points at $2,750 and $2,850; a continued breakout above these could solidify a bullish flag pattern and propel prices to the $3,000 level. Yet, technical indicators like the RSI, Stochastic Oscillator, and MACD indicate declining momentum, implying a fall below important support levels around $2,500 and $2,100 would result in a more significant correction.
Ethereum investors have taken $1.5 billion in gains following last week’s 30% gain, sending short-term falls into the region of $2,530. Firm inflows into accumulation addresses override selling pressure and reinforce bullish sentiment. Fundamental resistance at $2,750 and $2,850 will be pivotal for ETH to continue its advance towards $3,000.
• The price of Ethereum retreated from $2,700 to approximately $2,530 as investors withdrew $1.5 billion of profits following a 30% climb during the previous week.
• The selling pressure grew among all age groups, including long-term holders, as evidenced by an increase in ETH’s Age Consumed and drop in Mean Coin Age.
• Not withstanding the sell-off, more than 640K ETH entered accumulation addresses and staking protocols, symbolizing continued bullish appetite.
• Ethereum bulls hold up, averting a steeper price fall as more profit-taking is seen.
• ETH has key resistance points at $2,750 and $2,850; breaking and holding above these may confirm a bullish flag formation.
• A breakout would drive ETH prices above the $3,000 psychological level.
• Technical metrics such as RSI, Stochastic Oscillator, and MACD indicate fading momentum, and a fall below $2,100 is likely to result in more downside risk.
Ethereum investors recently took outsized profits after a solid rally, harvesting some $1.5 billion in gains. This profit-taking indicates increasing confidence among investors who rode the recent price surge. Meanwhile, most holders are still stacking and staking their Ethereum, indicating long-term optimism is strong despite some selling.
ETHEREUM DAILY PRICE CHART
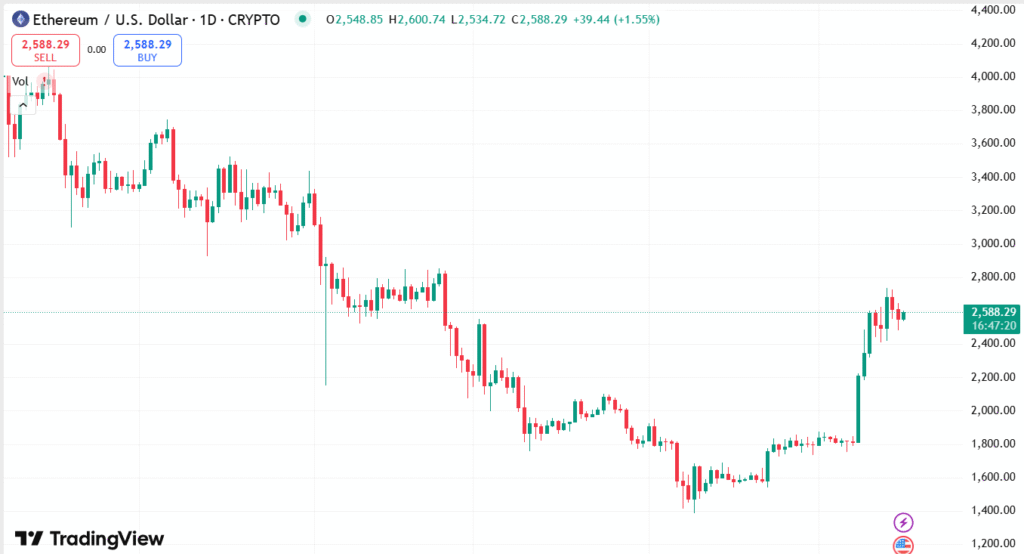
CHART SOURCE: TradingView
The market sentiment is overall cautiously optimistic as Ethereum approaches key levels that might define its next course of action. If the momentum is sustained, Ethereum may draw in additional buyers and possibly hit new highs. But investors are waiting closely on how the market develops in the next few days, weighing taking profits versus holding for additional appreciation.
TECHNICAL ANALYSIS
Ethereum is presently charting important resistance levels at $2,750 and $2,850, which will be pivotal in validating a possible bullish flag formation—a signal that will open the gates to further upside towards $3,000. But momentum indicators such as the RSI, Stochastic Oscillator, and MACD are indicating that the bullish strength is fading, prompting caution as price finds support near $2,500 and $2,100. Failure to maintain these levels of support would more likely result in a further correction, and a breakout through resistance above the level would most probably reinitiate upward momentum.

FORECAST
If Ethereum is able to break and hold above the critical resistance levels at $2,750 and $2,850, it might validate a bullish flag formation that could propel the price towards the $3,000 psychological barrier. Sustained investment into accumulation addresses and staking protocols reflect strong demand from long-term investors, which may help buttress further buying pressure. Healthy market sentiment and increased buying pressure may enable ETH to overcome recent selling and move towards new highs in the near term.
Conversely, if selling pressure continues and Ethereum declines below the significant support level of $2,500 to $2,100, it may indicate a more profound correction phase. Technical momentum indicators suggest declining bullish strength, further heightening the threat of an even longer pullback. A fall below $2,100 may leave the gate open for ETH to probe lower support areas, possibly at $1,688, which would rattle investor confidence and extend the consolidation phase.