
Bitcoin is signaling the possibility of a near-term correction as it dips below the critical level of $116,000, shattering its recent range-bound pattern. The fall is bolstered by weakening technicals in the form of a bearish MACD and RSI crossover, indicating waning bullish momentum. Also, US-listed spot Bitcoin ETFs experienced a modest weekly outflow of $58.64 million, putting an end to a six-week inflow stint, further contributing to the bearish sentiment. With increasing open interest indicating more short positions and no short-term relief from US macroeconomic fundamentals or interest rate reductions, BTC might experience more downward pressure in the near term.
KEY LOOKOUTS
• A close below this significant level daily might seal the deal for more downside, with targets in the vicinity of $111,410 (50-day EMA) or even the former ATH of $111,980.
• Ongoing US spot Bitcoin ETF outflows totaling $58.64 million for the current week might reflect diminishing institutional confidence and add pressure to the price further.
• Bearish MACD and RSI crossovers on daily and weekly charts indicate falling momentum and higher likelihood of a correction.
• Strong US economic data and the hawkish tilt from the Fed lower the odds of near-term rate cuts, taking the steam out of investor desire for risk assets such as Bitcoin.

Bitcoin is experiencing increased selling pressure as it drops below the critical support of $116,000, indicating a possible continuation of its short-term correction. This action follows against a backdrop of weakening technical strength, with both the MACD and RSI showing bearish indications. Contributing to the risk-averse sentiment, US-listed spot Bitcoin ETFs have seen a weekly outflow of $58.64 million, the first outflow in six weeks and reflecting a slowing in institutional demand. In addition, increasing open interest in conjunction with decreasing prices indicates a rise in short positions that can hasten the decline if bearish momentum continues.
Bitcoin is below $116,000, breaking its recent range and indicating a possible short-term correction. Slowing momentum and ETF withdrawals indicate rising bearish pressure with downside risk intensifying.
• Bitcoin has fallen below the lower edge of its range of consolidation, indicating possible further downside.
• US-listed spot Bitcoin ETFs saw a moderate weekly outflow of $58.64 million, ending a six-week inflow streak.
• Both daily and weekly RSI and MACD indicators reflect bearish indications, pointing to deteriorating bullish strength.
• Open Interest has hit an all-time high of $44.5 billion, pointing towards growth in short positions during downward price movement.
• If BTC remains below $116K, the next important support is around the 50-day EMA at $111,410 or the last ATH at $111,980.
• Strong US economic reports and the hawkish tilt of the Fed reduce the prospects of interest rate reductions, putting extra pressure on risk assets.
• A close above $120K on a daily basis might render the bearish scenario useless and allow for a retest of the $123,218 all-time high.
Bitcoin’s sentiment this week is tempered by increasing investor wariness and pending macroeconomic headwinds. One of the most significant developments is the modest outflow from US-listed spot Bitcoin ETFs, to the tune of $58.64 million. This represents the end of a six-week inflow trend and indicates a potential reversal in institutional sentiment. The outflows, while modest, are an indication of early warning signs of a possible pullback in investor confidence. The increase in open interest, usually coupled with speculative activity, is also indicative that traders are refocusing their strategies amid shifting market conditions.
BITCOIN DAILY PRICE CHART
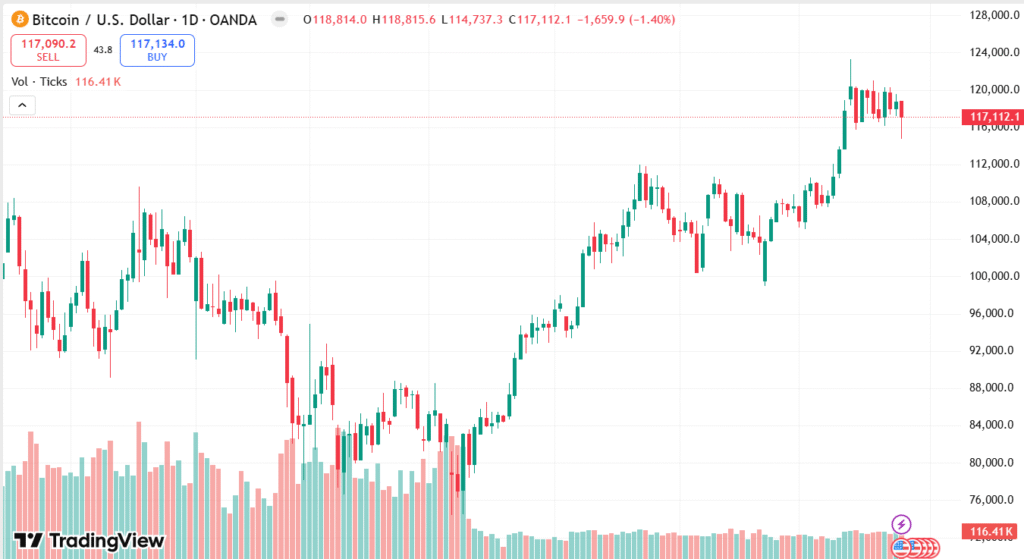
SOURCE: TradingView
Apart from crypto-specific influences, general economic conditions also play a role in shaping sentiment. The US economy remains robust, with solid labor market readings and ongoing inflation pressures diminishing the chances of any near-term interest rate reductions by the Federal Reserve. At the same time, continued global trade updates—like a possible deal between the US and EU—are watching investors closely. Although geopolitical advancements like these may tighten market confidence, the present uncertainty is promoting risk aversion in the space of crypto.
TECHNICAL ANALYSIS
Bitcoin is displaying weakening momentum as it trades below the significant support of $116,000, breaking its recent range of consolidation. The Relative Strength Index (RSI) on the weekly chart has fallen away from overbought, currently at 65, and the daily RSI has fallen to 51 and is trending lower. This move signals diminishing bullishness. The Moving Average Convergence Divergence (MACD) on the daily chart also registered a bearish crossover, indicating potential further downside. If BTC cannot recover the $116K level, it could test the 50-day Exponential Moving Average (EMA) around $111,410, with continued pressure anticipated should bearish sentiment continue.

FORECAST
If Bitcoin is able to recover and close above the $116,000 level, it may indicate a possible rebound from its current retreat. A sustained advance above this threshold might prompt fresh buying interest, particularly if ETF flows normalize or turn into inflows. If BTC clears the top consolidation line of $120,000, it may set its sights on retesting the new all-time high of $123,218. Further encouragement of this bullish course may come from sustained optimism over global trade developments or positive macro changes.
Downside risks include if it cannot regain $116,000, pushing Bitcoin into correction and further into key support regions. A conclusive daily close below this level raises the probability of a fall towards the 50-day EMA at $111,410, and even to the prior all-time high of $111,980. Increasing open interest with falling prices indicates heightened short positioning, which can reinforce bearish pressure. Further ETF redemptions and a strong Fed line on interest rates can also restrict upside and dampen market sentiment.