GBP/USD is trading under pressure around 1.2450 in the early European session on Monday, weighed down by renewed demand for the safe-haven US Dollar. Despite the dip, the pair maintains a bullish outlook above the 100-period Exponential Moving Average (EMA) on the 4-hour chart, supported by a positive RSI reading of 64.70. Immediate resistance is seen at the 1.2500-1.2510 zone, and a break above could target 1.2551 and 1.2607. On the downside, key support is seen at 1.2350, and a breach of this level opens the door to further declines toward 1.2250 and 1.2160. Traders are advised to watch these levels for breakout or reversal signals.
KEY LOOKOUTS
• The 1.2500-1.2510 level, which marks a confluence with the upper Bollinger Band and psychological resistance. A breakout might open the way towards 1.2551 and 1.2607.
• The 1.2350 mark, coupled with support from the 100-period EMA, is an important barrier on the downside. A penetration could lead to additional falls to 1.2250 and 1.2160.
• The RSI hovering above the midline at 64.70 supports the bullish outlook. Sustained strength in this zone indicates further upside potential in the near term.
• GBP/USD remains within Bollinger Band boundaries. Any decisive move beyond the upper or lower band could indicate heightened momentum for bullish or bearish trends.
GBP/USD remains under selling pressure around 1.2450 during Monday’s early European session, influenced by renewed demand for the safe-haven US Dollar. Despite this, the pair maintains a bullish outlook, staying above the 100-period Exponential Moving Average (EMA) on the 4-hour chart. The Relative Strength Index (RSI) at 64.70 further supports the potential for upward momentum. Key resistance is seen at the 1.2500-1.2510 zone, with a break above potentially targeting 1.2551 and 1.2607. On the downside, the crucial support level at 1.2350 aligns with the 100-period EMA, and a breach of this could lead to further declines toward 1.2250 and 1.2160.
GBP/USD trades near 1.2450, amid fresh US Dollar strength. The pair is still bullish above the 100-period EMA but present critical resistance at the 1.2500-1.2510 level, and today important support is at the 1.2350.
•GBP/USD trades near 1.2450 in the morning European session under strong selling pressure from renewed interest for the US Dollar.
•The pair holds above the 100-period EMA in the 4-hour chart and therefore a bullish perception is ensured.
• The RSI is still above the midpoint at 64.70 and susceptible to more upward movement.
• The psychological level and the level of the top Bollinger Band boundary is at 1.2500-1.2510.
• If the price reaches 1.2510 level, then it could move to 1.2551 and further to 1.2607 as seen in the high of January 6 and December 30.
• The 100-period EMA is also at 1.2350 level, and thus this is very crucial support for the currency pair.
• A drop below 1.2350 could open up more losses to 1.2250 and 1.2160, the lower Bollinger Band and January 20 low.
GBP/USD is trading around 1.2450 in early Monday’s European session, weighed down by the re-emergence of safe-haven demand for the US Dollar. Despite selling pressure, the pair remains positive, staying above the 100-period Exponential Moving Average on the 4-hour chart. The Relative Strength Index at 64.70 is also pointing to the upside, while a further resistance level is seen at 1.2500-1.2510, the upper Bollinger Band, and the psychological level. Higher action would be seen if the pair were to make a decisive breakout at this point toward 1.2551 and 1.2607, both these had acted as highs in January 6 and December 30 respectively.
GBP/USD Daily Chart
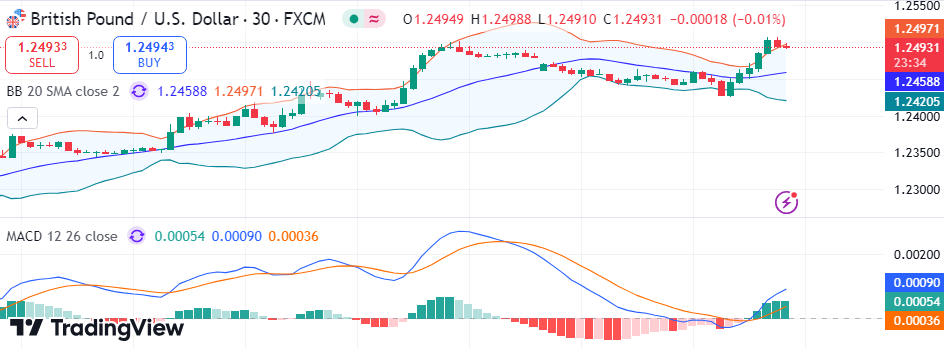
TradingView Prepared by ELLYANA
On the flip side, the critical support lies at 1.2350, which is supported by the 100-period EMA. A break of the latter can send GBP/USD even lower to target 1.2250, then 1.2160, which serves as the lower Bollinger Band and marks the January 20 low. Traders must be very vigilant about those levels and look for a breakout or reversal signal there. The overall technical aspect is positive so long as the pair is maintained above the crucial support levels. The RSI supports the bullish aspect, at least for now.
TECHNICAL ANALYSIS
The price action of GBP/USD exhibits a bullish direction, as it sustains trading above the 100-period Exponential Moving Average on the 4-hour chart, which indicates powerful bullish momentum. Relative Strength Index, currently at 64.70, indicates that there will be continued buying. The Bollinger Bands are bringing the pair toward the upper boundary near the key resistance zone of 1.2500-1.2510, which is a psychological level. If the pair can break above this resistance, it will propel it toward the next upside targets at 1.2551 and 1.2607. The downside critical support lies at 1.2350, where the 100-period EMA gives a strong defense. A breakdown of this support could bring further declines targeting 1.2250 and 1.2160. From a technical analysis perspective, the outlook appears positive, and key levels will be watched for breakouts or reversals.
FORECAST
The GBP/USD pair is seen bullish as it stays above the 100-period Exponential Moving Average (EMA) on the 4-hour chart. Relative Strength Index at 64.70 further supports positive momentum and, therefore, possible upward movement. The immediate resistance on the psychological area is seen between 1.2500 and 1.2510 also in line with the upper Bollinger Band; a successful breakthrough above this range could take it to 1.2551; the high is seen on January 6, and towards 1.2607 high on December 30, 2024. At these levels one finds the bulls’ next major test for continued rallies in the shorter term.
On the negative side, the critical support level is at 1.2350, which also aligns with the 100-period EMA. A break below this level could weaken the bullish case and expose GBP/USD to further declines. Next key support levels to watch are 1.2250, near the lower Bollinger Band, and 1.2160, the low of January 20. These levels will be important for gauging the strength of bearish pressure if the pair is unable to stay above 1.2350. Traders should monitor these downside risks particularly if renewed US Dollar strength remains an influence on the pair.