GBP/USD pair remains under bearish pressure, trading modestly higher near 1.2445 in early European hours on Thursday. Despite a slight decline in the US Dollar offering temporary support, the pair holds below the key 100-day EMA, maintaining a negative outlook. The 14-day RSI hovers near the midline, suggesting potential consolidation. Key support levels lie at 1.2400-1.2390, with further downside targets at 1.2307 and 1.2160. On the upside, resistance is at 1.2570, followed by 1.2645 and 1.2778. Traders are now focusing on the US Q4 GDP, Initial Jobless Claims, and Pending Home Sales to be released soon for further direction in markets .
KEY LOOKOUTS
• A key point below the 100-day EMA continues to maintain downside pressure below this barrier down to 1.2400 and lower 1.2307 and then 1.2160 support.
• There is strong major resistance at 1.2570 with potential higher resistance to be seen within 1.2645 near the 100-day EMA and 1.2778 at the last December 10 high.
• US Q4 GDP, Initial Jobless Claims, and Pending Home Sales could determine the course of short term market action today for GBP/USD.
• The 14-day RSI hovers near the midline, indicating possible sideways movement before a decisive breakout or breakdown in the coming sessions.
The GBP/USD pair continues to trade under bearish pressure, struggling below the 100-day EMA and maintaining a downside bias as long as it remains under 1.2450. Key support levels to watch include the 1.2400-1.2390 region, with further declines potentially extending to 1.2307 and 1.2160 if selling pressure persists. On the positive side, resistance at 1.2570 is the first major barrier, followed by 1.2645 and 1.2778. Market participants are closely monitoring upcoming US economic data, including Q4 GDP, Initial Jobless Claims, and Pending Home Sales, which could provide fresh directional cues. Meanwhile, the 14-day RSI remains near the midline, suggesting a potential consolidation phase before a decisive move in either direction.
GBP/USD stays bearish below 1.2450, and it finds strong support at 1.2400-1.2390 with a possible slide to 1.2307. It will find resistance at 1.2570 to limit upside potential. The Q4 GDP in the US is going to determine the market’s direction.
• As long as it is below the 100-day EMA, GBP/USD is likely to remain under pressure.
• The first support zone is at 1.2400-1.2390, with further downside risks targeting 1.2307 and 1.2160 if selling momentum increases.
• The initial resistance is at 1.2570, followed by stronger hurdles at 1.2645 (100-day EMA) and 1.2778 (December 10 high).
• Traders are watching Q4 GDP, Initial Jobless Claims, and Pending Home Sales reports, which could impact market sentiment and price direction.
• The RSI indicator suggests possible consolidation before a decisive breakout, with no strong momentum in either direction for now.
• A mild decline in the US Dollar has helped GBP/USD post modest gains, but the overall trend remains bearish.
• If GBP/USD drops below 1.2400, it may trigger further selling pressure, potentially dragging the pair toward 1.2307 and 1.2160.
The GBP/USD pair remains in a bearish trend as long as it trades below the 100-day EMA, keeping downside risks in play. The pair currently hovers around 1.2445 in early European trading hours and has struggled to gain any momentum despite a mild decline in the US Dollar. The key support zone lies at 1.2400-1.2390, and a break below this level could accelerate selling pressure, driving prices toward 1.2307 and possibly 1.2160. On the flip side, resistance at 1.2570 remains a crucial barrier, with additional hurdles at 1.2645 and 1.2778, which could cap any bullish attempts. The 14-day RSI hovers near the midline, suggesting a phase of consolidation before the next major move.
GBP/USD Daily Chart
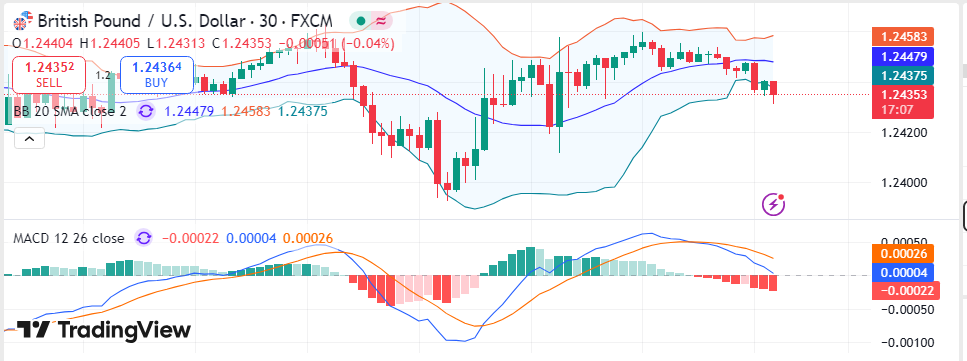
TradingView Prepared by ELLYANA
Market participants are closely monitoring the upcoming US Q4 GDP data, Initial Jobless Claims, and Pending Home Sales reports, which could influence GBP/USD price action. A stronger-than-expected GDP reading might boost the US Dollar, reinforcing the bearish outlook for GBP/USD. However, if the data disappoints, the pair could see a temporary recovery, challenging key resistance levels. Traders should also be on the lookout for global risk sentiment and central bank policy expectations since they could enhance volatility in the pair. On balance, these factors present a bearish view in the short run, but only a breakout above primary resistance areas will negate a bearish outlook.
TECHNICAL ANALYSIS
GBP/USD stays in a bearish trend as long as it stays below the 100-day EMA, which serves as a significant resistance level at the present time. The tandem has support right off the bat at 1.2400-1.2390, coalescing into the psychological level and the Jan 29 low. A firm breakout under this area could trigger further drops to 1.2307 and 1.2160. To the upside, resistance stands at 1.2570, with next target at the 100-day EMA at 1.2645 and the Dec 10 high at 1.2778. The 14-day Relative Strength Index (RSI) remains near the midline, indicating a potential consolidation phase before a breakout. Meanwhile, the Bollinger Bands suggest that the pair is trading near the lower boundary, signaling that any break below key support levels could accelerate bearish momentum.
FORECAST
Despite the prevailing bearish sentiment, GBP/USD has key resistance levels that could limit downside movements and trigger a recovery. The first upside barrier is at 1.2570, which corresponds to the upper boundary of the Bollinger Band. In case the pair breaks above this level, the next resistance would be at 1.2645, the 100-day EMA, which has historically been a strong resistance zone. A break above this level could be sustained and fuel bullish momentum toward 1.2778, the highest level reached on December 10. If it is much weaker than expected in terms of either GDP growth or the labor market in the United States, this could weaken the US Dollar further to support a higher move in GBP/USD.
The bearish outlook remains dominant as long as GBP/USD trades below the key 100-day EMA, with immediate support at the 1.2400-1.2390 region. A break below this level could accelerate selling pressure, exposing the pair to further downside risks. The following crucial support comes at 1.2307, the low of January 22, then at 1.2160, which represents the low of January 20. If bearish momentum prevails, then GBP/USD can go all the way to 1.2125, which is at the lower end of the Bollinger Band. A strong US Dollar, a hawkish Federal Reserve stance, or a risk-off atmosphere in global markets could continue the downward movement, and the case for the pair’s decline will remain.