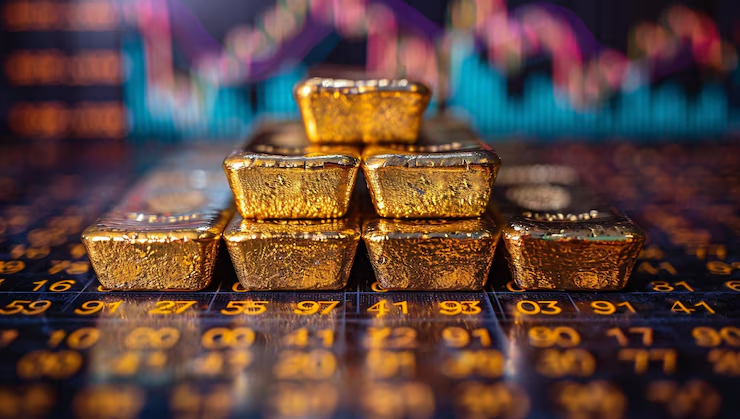
Gold prices surged past $2,900: Trump’s tariffs and global uncertainty fuel safe-haven demand
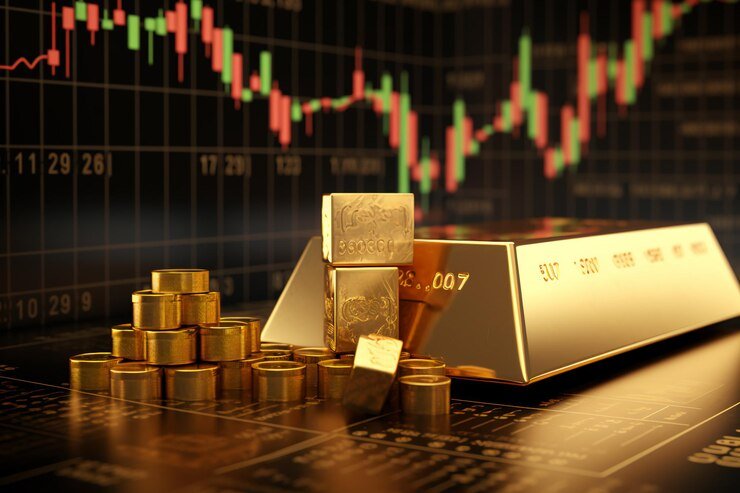
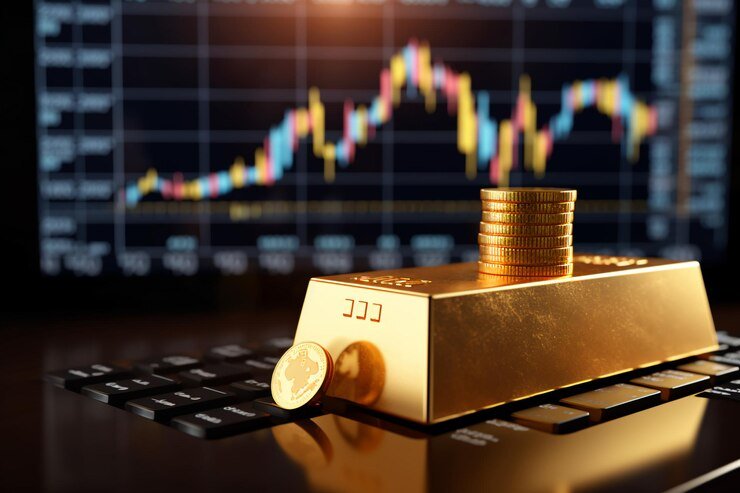
Gold price (XAU/USD) continues its bullish momentum, breaching the $2,900 mark to hit a fresh all-time high amidst growing safe-haven demand. The surge is driven by US President Donald Trump’s new tariffs on commodities, escalating global trade war concerns, and geopolitical tensions, particularly in the Middle East. Other positives include the prospect of increasing inflation with the pro-protectionist policies of President Trump, thus making gold more attractive as an economic uncertainty hedge. A weak US Dollar bounce and an overbought market have resulted in some intraday profit-taking before Fed Chair Jerome Powell’s congressional testimony. Even though the precious metal experienced some minor pullbacks, the bigger picture is bullish, and strong support is at key technical levels above $2,800, which supports additional upside. KEY LOOKOUTS • Global uncertainty rises with threats of US retaliation and reciprocal tariffs on commodities • Increasing skirmishes, in the Middle East for one, only heighten fears in markets that drive even greater demand for gold as an inflation hedge against volatility • Fed rate policy and future course under inflation concern and a surprising strong labor market. • Despite minor pullbacks, gold’s strong support above $2,800 and bullish trends suggest further upside potential in the coming sessions. Gold’s bullish momentum remains intact as it continues to trade above the $2,900 mark, driven by escalating trade war fears following Trump’s new tariffs and ongoing geopolitical tensions. Investors are turning to the safe-haven metal amid uncertainties surrounding global economic policies and Middle East conflicts. A stronger US Dollar and profit-taking have caused slight pullbacks, but gold’s strong technical support near $2,800 suggests limited downside risks. The market now awaits Fed Chair Jerome Powell’s testimony, which could provide further clarity on the Federal Reserve’s rate stance and influence gold’s next move. Gold price continues to hold strong above $2,900 on the back of Trump’s tariffs and geopolitical tensions, which increase safe-haven demand. Even minor pullbacks are capped by strong support near $2,800. Fed Chair Powell’s testimony may shape gold’s next move. • Gold price surges to a record high as safe-haven demand increases. • New US tariffs on commodities raise the specter of a global trade war, making gold more attractive. • Uncertainties, especially in the Middle East, push investors towards gold as a hedge. • Expectations of inflation because of Trump’s protectionist stance might influence the rate decisions of the Federal Reserve. • A modest recovery in the USD results in some profit-taking in the prices of gold. • Gold is well-supported above $2,800 and is limited in downside risks despite minor corrections. • Investors await Fed Chair Jerome Powell’s comments, which may affect the future course of gold. Gold’s price keeps on its bullish trend, going past the $2,900 mark and reaching a new all-time high as investors seek safety amid rising economic and geopolitical uncertainties. US President Donald Trump’s newly imposed tariffs on commodities, along with his plans for reciprocal duties on other countries, have fueled fears of a global trade war, significantly boosting demand for gold. Furthermore, increased political tensions, especially in the Middle East, have also contributed to gold’s safe-haven status. However, some intraday profit-taking occurred due to a minor US Dollar recovery. Yet, the bullish sentiment remains firm, with technical support levels around $2,800 capping the downside. XAU/USD Daily Chart TradingView Prepared by ELLYANA Looking ahead, market participants are watching the Federal Reserve’s policy stance very closely as Trump’s protectionist policies are likely to drive inflation higher, and this might have an impact on the Fed’s interest rate decisions. A hawkish stance from the central bank would strengthen the US Dollar and cap gold’s gains, while a dovish approach would further support the yellow metal’s rally. Investors are also waiting for Fed Chair Jerome Powell’s congressional testimony, which may give a clue about the Fed’s view on inflation and interest rates. While short-term fluctuations are possible, the broader technical setup suggests that gold is still on an uptrend, and strong demand is likely to keep prices elevated in the near term. TECHNICAL ANALYSIS Gold is still in a strong uptrend, comfortably above the $2,900 level, and with key support around the $2,800 level. Any pullback towards $2,886-$2,882 should attract fresh buying interest, which will reinforce the bullish outlook. A decisive break below this zone may push prices towards the $2,855-$2,852 region, but downside risks are limited because of strong demand. On the flip side, yesterday’s resistance came in near $2,943-$2,950; a next leg higher probably targets the $3,000 mark, but it is reflected in the daily chart – the overbought Relative Strength Index (RSI). The next leg higher might mean some consolidation or short-term correction. Traders will look forward to Fed Chair Jerome Powell’s testimony and the US Dollar’s movement for further directional cues. FORECAST The medium-term bullishness in gold will likely continue for the near term, with price action testing new higher resistance levels. If this buying pressure remains strong, then the next target to the upside would be in the $2,943-$2,950 area, with the psychological $3,000 barrier being a major obstacle before breaking above to start a new rally and take the long-term uptrend much further. Geopolitical tensions, inflation fears, and safe-haven demand will continue to fuel gold prices. The positive view on the yellow metal will continue. But, the price may see some pullbacks because of profit-taking and the US Dollar’s strengthening. If the price falls below $2,900, the initial support is seen around $2,886-$2,882, and the downside risks will extend toward the $2,855-$2,852 zone. Another more aggressive push in correction would push prices closer to the $2,834 level, but that level is expected to attract buyers, thus limiting further declines. Market sentiment will be highly driven by the monetary stance of the Federal Reserve and Jerome Powell’s testimony as any hints of a prolonged rise in higher interest rates would force short-term downward pressure on gold.