USD/CAD currency pair continues to feel the heat around the 1.3700 level during early Friday European trade, sticking to a bearish bias as it remains capped below the 100-day Exponential Moving Average (EMA). Technical charts that have a declining RSI below the 50 level reinforce a bearish stance with potential for further declines if the pair breaks below key support at 1.3660. As geopolitical tensions in the Middle East have the potential to drive safe-haven demand for the US Dollar higher, present resistance at 1.3746 and steep barriers above indicate limited short-term upside momentum.
KEY LOOKOUTS
• Breaking above this level may initiate further upside towards 1.3830 and 1.3945 (100-day EMA).
• Persistent weakness below this level may see a fall towards 1.3568 and possibly 1.3430.
• RSI continues to be under 50, supporting the bearish bias while price remains below the 100-day EMA.
• Rising Middle East tensions and possible US intervention may affect USD strength and affect USD/CAD direction.

USD/CAD pair still lingers around the 1.3700 level, under pressure to the downside as it fails to break through the 100-day Exponential Moving Average (EMA). Technical indicators, such as a bearish 14-day RSI at the lower end of the midline, indicate the bearish momentum is still intact. Important support is at 1.3660, and a breakdown below this level would leave the way open for more losses towards 1.3568 and potentially 1.3430. Resistance is at 1.3746 on the upside, stronger obstacles at 1.3830 and 1.3945. Geopolitical events, most importantly regarding possible US participation in Middle East tensions, can affect safe-haven demand for the US Dollar and shape the direction of the pair.
USD/CAD is capped below the 100-day EMA, remaining close to 1.3700 with a bearish technical configuration. A fall below 1.3660 might initiate further declines, while support at 1.3746 caps potential gains. Geopolitical tensions could influence USD demand in the short term.
• USD/CAD is trading at levels of 1.3700 in early European trading, still with a bearish tone.
• Pair is still below the 100-day EMA, adding to the bear pressure.
• RSI below 50 confirms sustained bearish pressure on the daily chart.
• First support is at 1.3660, with further support below at 1.3568 and 1.3430.
• Resistance at 1.3746 is immediate, followed by 1.3830 and 1.3945.
• Middle East geopolitical threats may impact US Dollar safe-haven demand.
• Market sentiment is subdued, with technical and fundamentals supporting a bearish bias.
The USD/CAD currency pair is gaining attention as the Middle East geopolitical tensions escalate, with speculation regarding potential American involvement fueling global uncertainty. Investors are keenly observing events, particularly in the wake of the White House announcement that President Joe Biden might make a decision within two weeks whether or not to align with Israel in the war. Such geopolitical uncertainty normally creates greater demand for safe-haven currencies such as the US Dollar, which could influence the movement of the pair regardless of underlying economic fundamentals.
USD/CAD DAILY PRICE CHART
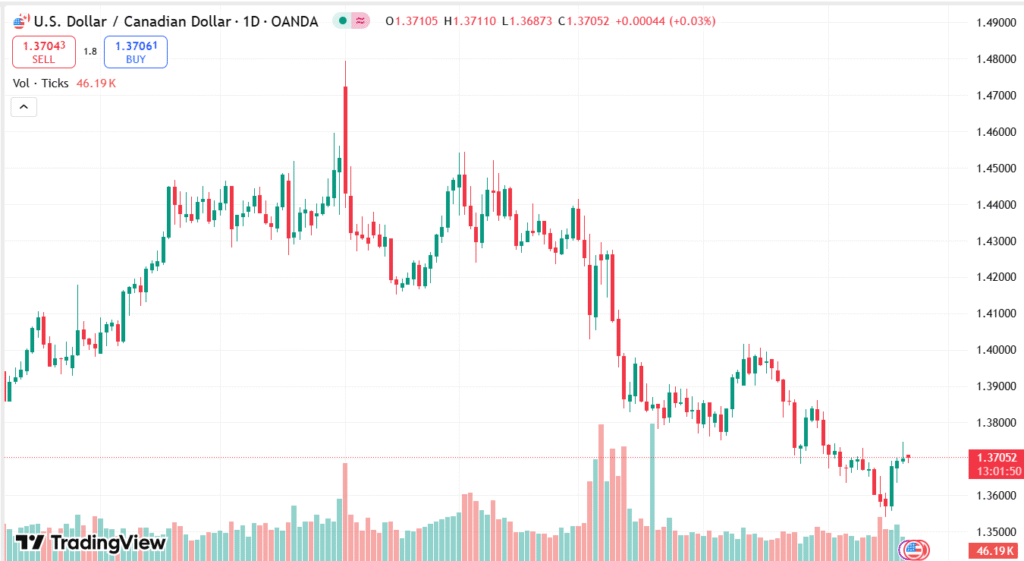
SOURCE: TradingView
In the meantime, market participants continue to keep an eye on wider macroeconomic signals, such as future US economic data reports and any change in the policy direction of the Federal Reserve. Within Canada, domestic growth indicators and the next policy action from the Bank of Canada are of interest. The interplay of central bank positioning, global risk sentiment, and geopolitical events will probably dictate the direction of USD/CAD in the next few days and hence form a highly observed currency pair within the present market scenario.
TECHNICAL ANALYSIS
USD/CAD has a bearish bias as it continues to be topped by the 100-day Exponential Moving Average (EMA), a significant resistance. The 14-day Relative Strength Index (RSI) hovers below the 50 mark, signaling that bearish momentum is still in play. Immediate support is seen at 1.3660, the low from June 6, and a break below this level could lead the pair toward 1.3568, the lower boundary of the Bollinger Band, and eventually to 1.3430. On the positive side, 1.3746 is the initial resistance level, and additional hurdles are at 1.3830 and the 100-day EMA at 1.3945. Until the pair crosses above these resistance levels, technical bias still leans to the bearish side.

FORECAST
If USD/CAD is able to hold above the immediate resistance at 1.3746, it may trigger a short-term rally to 1.3830, which is the upper edge of the Bollinger Band. A decisive break above this level would likely spur more bullish momentum, potentially challenging the 100-day EMA around 1.3945. This, however, would take strong fundamental support, perhaps from good US economic news or a sudden spurt in safe-haven buying for the US Dollar.
On the negative side, a persistent failure to stay above the 1.3660 support may trigger further selling pressure. A bold break below the same level may set the way for 1.3568, while prolonged losses may extend the pair to 1.3430—Sept 2024’s low. The technical setup, complemented by a weak RSI and resistance-plentiful upside, indicates that the path of least resistance is still southward unless a strong driver is present to change sentiment.